My last piece of work of 2017 was a treat, and worth resurrecting this blog for. Some time ago, Tabitha Tuckett in UCL Special Collections and I had a stimulating chat which sparked a handful of potentially intriguing projects. Today’s was to see whether we could find any interesting features associated with the printed diagrams in the margins of the first printed edition of Euclid’s Elements.
Euclid wrote the Elements in about 300BC and it effectively defined mathematics for the next two thousand years. He wrote it in Greek (some of it is probably a compilation of earlier works) and it was translated into Latin but it eventually became lost to Western Europe. Fortunately, it was translated into Arabic and found its way to a remarkable monk called Adelard of Bath who translated it (possibly three times) and other scientific works into Latin in the twelfth century.
The Gutenberg Bible was printed in the 1450s, but the earliest printing techniques were unable to reproduce the diagrams which were needed to accompany the text in the Elements. These are mainly lines, circles and arcs of circles. Text was printed with metal type, dropped capitals were added with carved wooden blocks and then the rubricator came and painted on the red (‘rubric’) highlights (I learnt a lot today!). That was all standard printing practice by the 1480s, but in the dedication to the first printed edition of the Elements, the printer (a chap called Erhardt Ratdolt) says that for the first time, he’d worked out how to print diagrams but wasn’t going to say how he did it. His methods are still unknown. It is believed that he used strips of metal which, as a printer, he would have had in his workshop, bent them to shape and embedded them in a supporting matrix such as wax. UCL Special Collections have a copy of the 1482 first edition (and the 1491 second edition and 400 others, many of which have been digitised).
The question that Tabitha posed was whether we could detect and image depressions in the page which resulted from the printing process which might give clues as to the methods used to print the diagram.
We decided to use Optical Coherence Tomography. Peter Munro at UCL Medical Physics and Biomedical Engineering has just bought a new system and we were keen to try it out. OCT has been one of the biggest successes of biomedical optics in the last thirty years, having gone from a lab invention in the early 1990s to a standard test for imaging the retina and other parts of the body. It uses near infrared light, so it’s safe, and splits it into two arms using a mirror. One arm is used as a reference and the other illuminates a sample. If light on its way to the sample and back travels the same distance as light going along the reference arm and back, the two beams of light add together and appear bright. However, if light penetrates the sample, reflects and then returns, the distance it has travelled is changed and the light no longer adds together. This allows us to build up an image showing where light has interacted most strongly with the sample. The spatial resolution of OCT is ten micrometres or so, and it can penetrate a couple of millimetres into tissue. It’s also being used in heritage applications.
Normally, OCT is used to look for features below the surface, but we know that paper scatters light very strongly so we won’t get much detail of the structure of the paper itself. Here, we’re using it mainly to track any changes in the surface of the paper, which might be due to the printing process.
We first looked at the first page of the Elements (ref UCL SPECIAL COLLECTIONS INCUNABULA QUARTO 5q, which was well looked after by Angela Warren-Thomas, a Senior Conservator at Special Collections). It has diagrams, but also text, a grand dropped capital and glorious ornamentation around it. We examined the diagrams, text and the dropped capital, but couldn’t see any clear indentations.

Optical coherence tomography of the first page of Euclid’s Elements
However, when we looked closely at the diagrams, they looked a bit odd. It took me a while to work out why, as I’m now used to looking at perfectly printed diagrams all the time. But back in school when I had to draw diagrams like this, I’d have drawn the circle and then fitted the straight lines to the circle. These had clearly been done the other way round – the straight lines were perfect, but the circles were all over the place. The part of the circumference around C in the photo below is clearly not aligned with the rest of the circle.

Close up of a diagram
We wondered whether the first page would have been handled more than later pages, such that any depressions in the page might have softened over time. So we moved to another page (page c1r in the Byzantine and extremely unhelpful page numbering system). Here, we had more success.
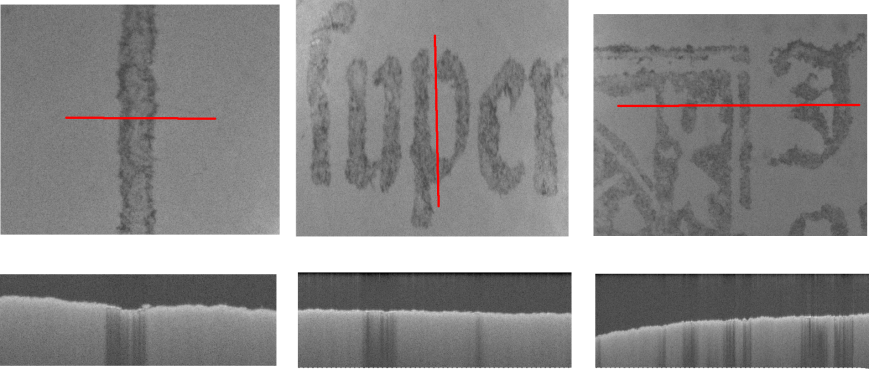
OCT images of (from left) a line through a diagram, text and a dropped capital.
The top row of images above are OCT images showing a line through a diagram, some text printed with metal type and a woodcut ornamental dropped capital. All these are slices through a 3D volume, with the slice chosen to be close to the surface of the paper. Close examination of the line from the diagram shows a “tramline” effect, where there are intense lines of ink following the edge of the line with less ink in the middle. This is commonly seen in printed ink when the printing process acts to squash the ink away from the middle of the line.
The bottom row of images are OCT images taken roughly along the red lines shown in the row above. The horizontal direction of the image shows distance along the paper, but the vertical direction shows depth into the printed page. The vertical bands are shadows where the ink on the surface has prevented light from penetrating the paper. On the left hand image, showing a line from a diagram, it looks like there is a dip in the surface corresponding to the ink. There is no such dip on the text or the woodcut. We consistently saw this dip in the inked diagrams and not elsewhere. We never saw a dip at a distance from the lines, which could suggest that if the metal strips were held in a frame, the frame was quite some distance from the paper.
We repeated this on the second printed edition of Euclid and curiously didn’t see the dip corresponding to the ink lines on the diagrams. However, it was printed differently, with different paper so it’s hard to compare different books.
We can do more analysis on the OCT data, including quantitative measurements of the depth of the depressions, but our results suggest that Ratdolt did use a different method to print the diagrams and the text. It looks like he at least typeset the straight lines before he typeset the circles and he may have printed them separately. If he did print them with metal strips in a mould, he did it in such a way that the mould did not apply significant pressure to the paper. We also wonder whether the printer of the second edition used a different technique for the diagrams than Ratdolt did for the first.
It’s exciting to think that modern imaging methods might be able to cast light on Ratdolt’s 500 year old printing innovation.

Erhard Ratdolt
LikeLike
Pingback: Editors’ Choice: Imaging the First Printed Edition of Euclid’s Elements
Pingback: DH Talk of the Town – Leggere, scrivere e far di conto